Understanding Project and Task Statistics
The Statistics are a group of metrics that indicate how well a project is progressing. The Reports section displays various statistics of the project or task group selected from the Show Project drop-down.
If you are the Admin or Secondary Administrator then you can see the statistics of tasks for all the users. As a Project Manager or power member, you can see task statistics of every member in your project. If you are a normal member or reader, you can view your own task statistics.
A table like the one shown below would be displayed.
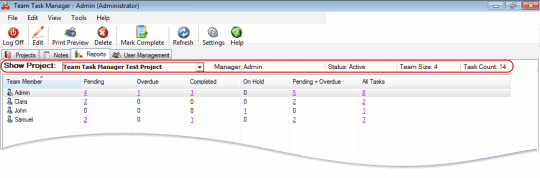
If you want to view the task details, then click on the corresponding value in the chart, all those tasks will be shown in the Quick List View at the bottom. If you need to modify this task then double click on the task shown in the Quick List View. You can mark complete or delete the task shown in this list. If you want to print these tasks, click on Print Preview options from toolbar. If no tasks are listed in Quick List View then All Tasks of the selected project or task group are printed.
This chart gives you a clear indication of the performance of the team members.
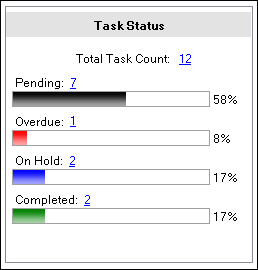
Task Status displays the status of the tasks in the selected project or task group. For example, if you select Team Task Manager Test Project from the Show Project drop-down, then the status of different tasks would be shown along with horizontal bars for easy understanding. If you select 'All Projects', then the status of the tasks in all the projects you are a member of will be shown.
|